
> Welcome Aboard, Voyager_

ONE TIMELINE.
INFINITE STORIES.

A multitrack timeline builder and data visualization tool,
powered by the Sequential Coordination Engine
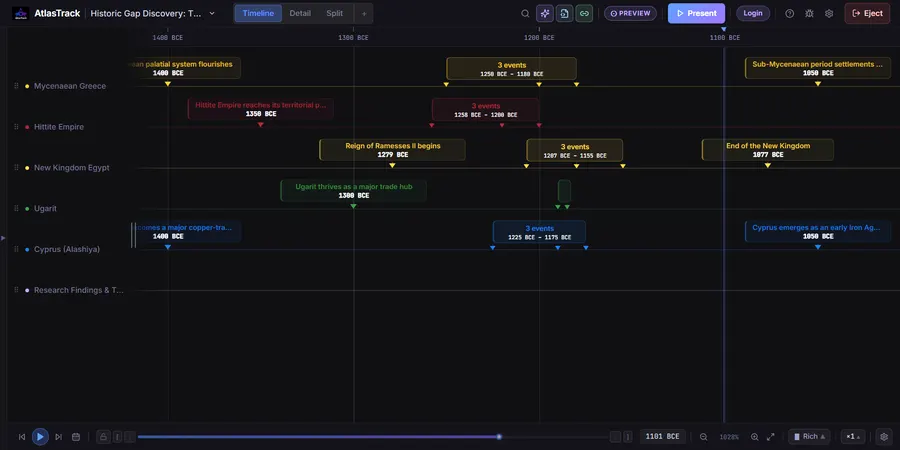
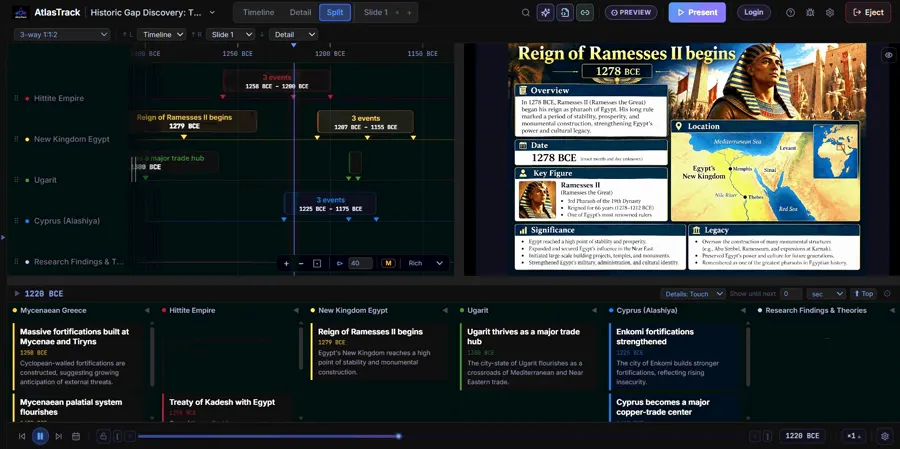
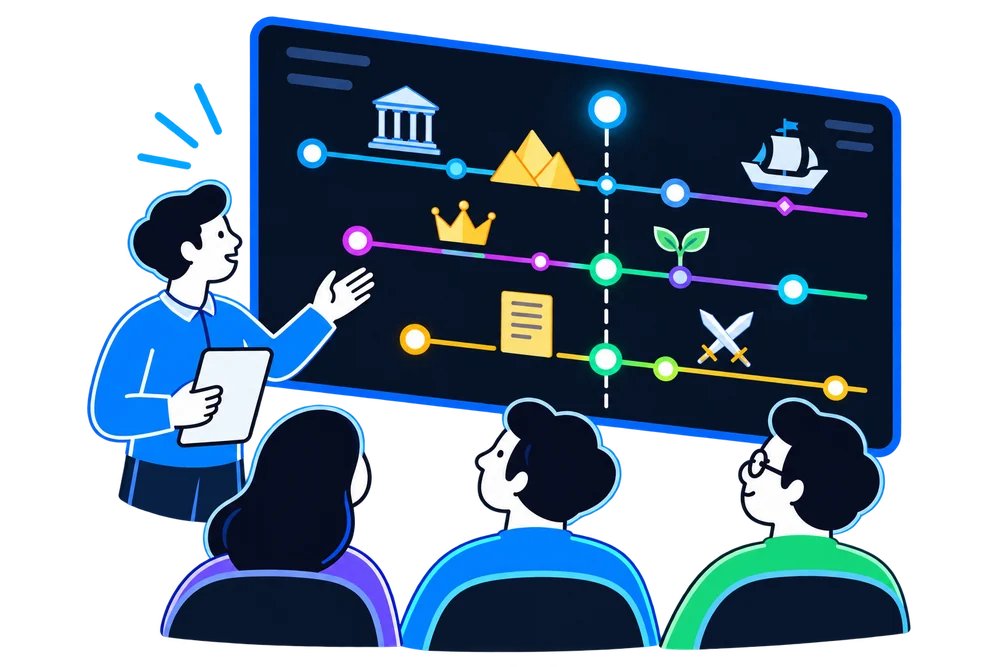
Every timeline, graph, and slide moves on one synchronized cursor, revealing the context, the story, and the multidimensional truth underneath your data, all from one place.

> System Error: The Four-Context Shuffle
Your story gets
crushed by your data.
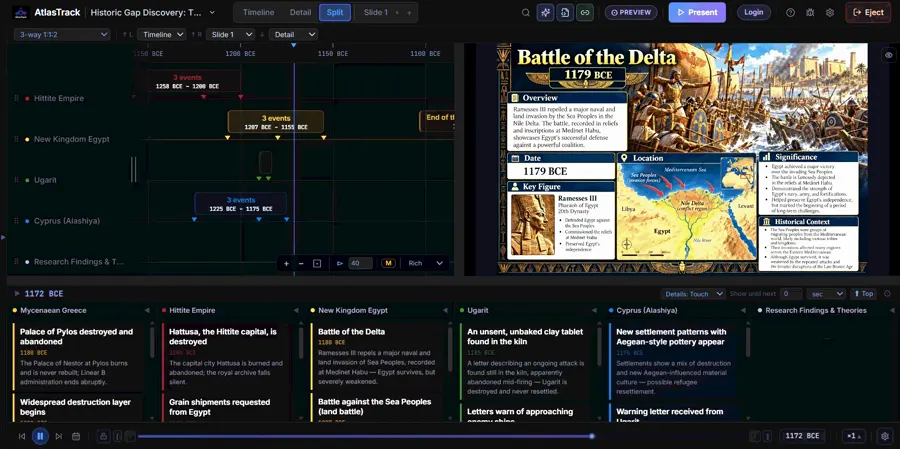
A timeline with too many events turns into a smear, and so does a slide deck packed with graphs. Either way the story gets buried under the data, and the chart, the timeline and the slides sit in separate files that can't change when the room asks something new.
- > A crowded timeline or a slide full of graphs hides the one moment that matters — it is in there somewhere, but nobody can find it.
- > Someone asks “what about last year's numbers” — the most common answer is “let me get back to you.”
- > The chart, the write-up, and the slide deck all live in different files — none of them update when the meeting takes an unplanned turn.

[WARNING] DATA, NARRATIVE, AND PRESENTATION DETECTED IN SEPARATE FILES
:: RECOMPOSING WOULD REQUIRE FORMAT TRANSLATION_
> Resolution_
How AtlasTrack fixes it.

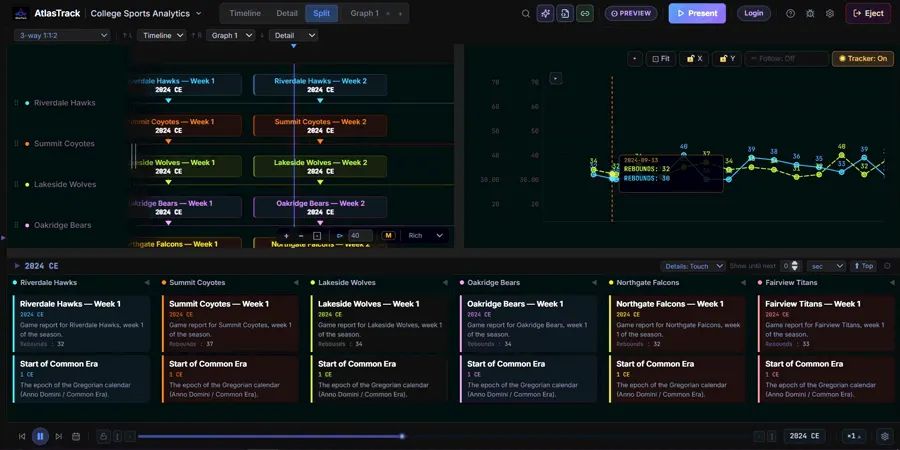
The chart, the timeline and the slides share one cursor, so the idea stays clear even when the data gets big.
“What else happened around the same time?”
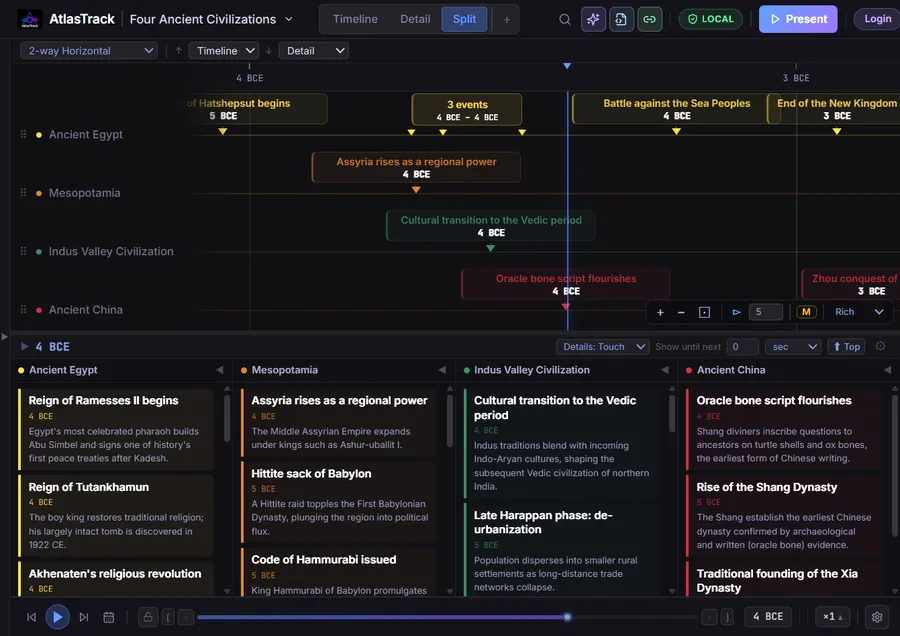
Every track — timeline, graph, slide — sits on one synchronized cursor, so a question about parallel events gets answered by pointing, not searching.
“How much are they spending?”
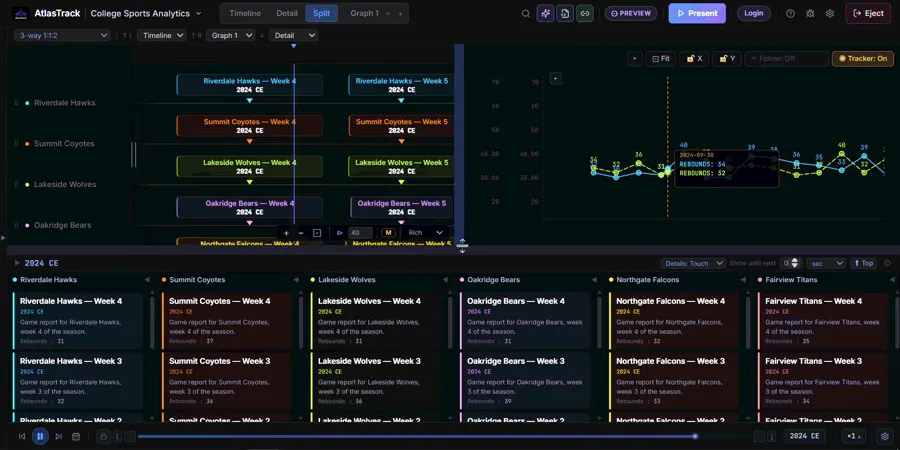
Two competitors' revenue is already up, live, in the room. Someone asks about cost — it's added as a third line on the same chart, right in front of them, without ever leaving the view you're presenting from.
“What conclusion can you draw?”
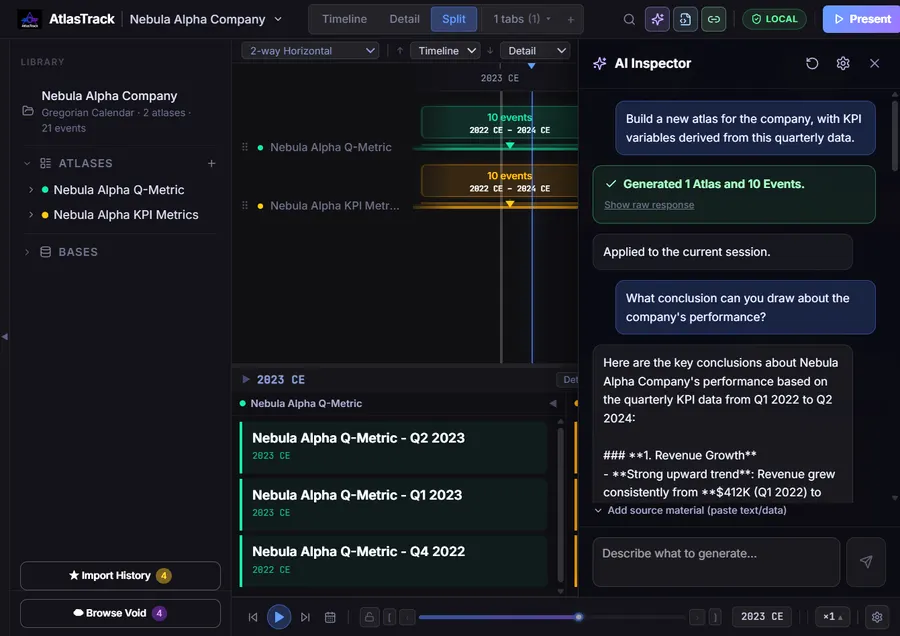
Ask the AI Core to compute a metric across your data, review the change before it's applied, then ask what it means — in the same conversation, on your own data, with your own key.
> Community Uplink_
A library built by its community.

Be a pillar of the story.
Like the old internet: go by a handle, publish a timeline of what you know best about history, lore, sports or markets, and let anyone explore it.
Our journey has only just begun, and the Library is just getting started. We are actively looking for Voyagers to publish what they know: the history of our planet, a discovery, a story worth a timeline. The first timelines on a topic are the ones everyone else can fork, extend and build on. It's your chance to be the center of the multiverse.
No data for sale
We don't sell your data. Ever.
Not to advertisers, not to data brokers, not to anyone. The app runs no ad tracking or third-party analytics.
A screen name, not a profile
Stay anonymous.
AtlasTrack doesn't keep the personal info tied to your sign-in account. Your email stays in the login system under an auto-generated ID, used only to sign you in and never linked to your profile or what you publish. Others see just your content and screen name.
Your role, your call
Reader, publisher, or both.
Browse the Server Library's public timelines without an account, publish when you're ready, or keep everything to yourself. You're never pushed into any of it.
Ranked by people
No algorithm, no promoted posts.
The Library is sorted by what the community does: most imported, highest rated, newest, and most forked.
Build on each other
Fork, extend, republish.
Start from someone's published timeline, add your own take, and share it back. The Origin view shows where every idea came from.
Yours to manage
Edit or unpublish any time.
Published work belongs to the community, but you keep the author's controls. Unpublishing removes it from the Library, and forks others already made keep working. AtlasTrack only steps in to take down content that breaks our policies.
> System Log: What's Actually Free_
The core engine is ETERNALLY FREE.
Every timeline, every data visualization, every view, your own data vault, and AI-assisted editing — free, permanently, for using it on your own. Paid plans exist only when you need to scale to a team — never for the core product itself.
> Pricing Philosophy_
Free to use. Priced to scale.
FREE
- Full timeline & data visualization engine
- All views — timeline, map, relationship, graph
- Offline / low-power hardware / Nomad Mode
- Personal Voyager Vault
- BYOK AI-assisted editing
COMING SOON
- Team accounts, built to scale
- Collaborative Fleet Vault for organizations
- API integrations
> If it runs in your browser, it's free. If it needs our server, it's paid — and that boundary isn't live yet.
> Who Is AtlasTrack For?_
Different people, the same underlying task.
Strategy & Marketing
Campaign data, market trends, and business reviews laid out on one timeline and turned into data storytelling — built for data-driven presentations, not just data dumps.
Team Leads & Project Managers
Recap decks, budget reviews, and project timelines for internal, time-pressured meetings — without needing a dedicated analyst on the team.
Historians & Worldbuilders
Timelines on custom time scales, relationships between events, and playback for sharing a chronology, real or fictional.
Fandom & Lore Creators
Power-scaling breakdowns, timeline explainers, and canon-gap theories — a native tool for content people already make by hand.
Research Communication
Not a replacement for R or Python — the last-mile layer that turns real findings into a narrated timeline for an audience.
Students & Professors
It's easy to lean on a flashy chart and skip the explanation. AtlasTrack keeps the data, its timeline, and the reasoning behind it in the same place, so coursework and lectures teach the context, not just the numbers.
> Call To Action_

Join the pre-launch.
“The universe doesn't care about your spreadsheet. Map the story.”
Launch AtlasTrack